


Score 43/100
98 Montgomery Montevallo Rd
Deatsville, AL 36022
- Purchase
- $0
- Est. rent
- $1,562/mo
- Cash flow
- $1,176/mo
- Cap rate
- 0.0%
Why we like it: hits the 1% rule · $1176/mo in positive cash flow after PITI.
See full rankingInvestment properties ranked by the highest monthly cash flow after mortgage, taxes, insurance, and all expenses. Updated every 12 hours with live data from 100 markets across 34 states.
Researched and analyzed byAustin Reese·Updated October 2026·Data sourced from market APIs and internal analysis tools
Updated October 11, 2026 · 30 properties
21 new deals added in the last 24h — see what changed below

Deatsville, AL 36022
$1,562/mo
$1,176/mo
0.0%
$0/mo

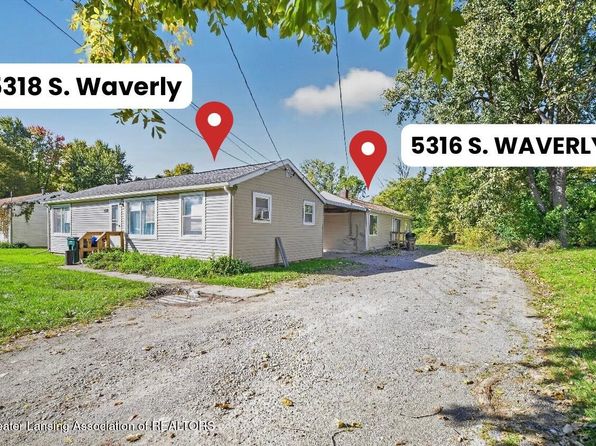
Alexander City, AL 35010
$1,103/mo
$784/mo
0.0%
$0/mo
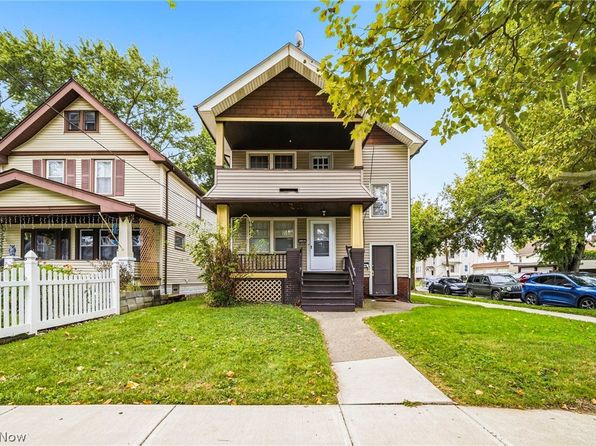
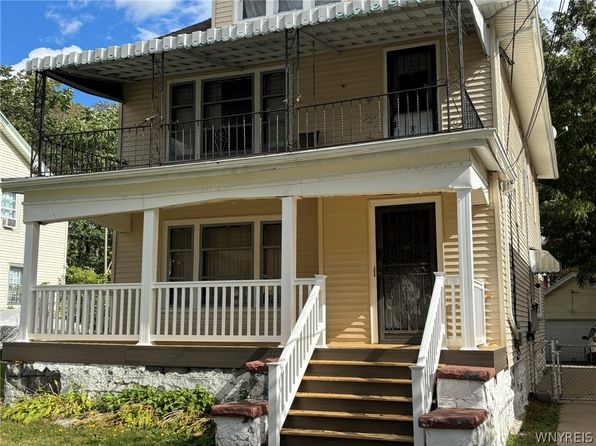
Cleveland, OH 44102
$2,700/mo
$772/mo
11.5%
$958/mo
Sign in and upgrade to Pro to access all 30 deals.
Cash flow is the income remaining each month after every dollar you owe on a property goes out the door — mortgage principal and interest, property taxes, insurance, vacancy reserve, maintenance reserve, property management, and HOA. Positive cash flow means the property pays you to own it. Negative cash flow means you're subsidizing the tenant.
Most investor sites pad their cash flow numbers by ignoring the boring expenses. RealixData refuses to. We assume 5% vacancy, 8% maintenance, and 8% property management on every deal — even if you self-manage — because property management is a real opportunity cost. If a deal still pencils after those haircuts, it's a real deal.
The deals you see on this page are sorted by net monthly cash flow descending, so the property at the top is genuinely producing the most month-to-month income after all expenses. We re-price every deal twice a day against live mortgage rates from FRED, current rent comps from RentCast, and the actual county tax bill from Realie. No Zestimate-only shortcuts.
What makes a strong cash flow deal in 2026? With 30-year investor mortgage rates hovering near 7% and home prices still elevated in most coastal metros, the math has shifted decisively toward Midwest, Southeast, and high-yield secondary markets. We see the most repeatable cash flow in markets like Memphis, Indianapolis, Cleveland, Birmingham, Kansas City, and St. Louis — places where a $180k purchase can rent for $1,650+/month. Coastal Florida, Texas, and the Carolinas remain strong but the entry price has moved up materially.
A property that generates $300–$500/month per unit in net cash flow is generally considered solid in today's market. $500+ per unit is exceptional. The deals on this page typically sit in the $300–$1,200/month range depending on price point, leverage, and local rent strength.
If you want to verify any deal yourself, run the address through our free Cash Flow Calculator — same model, same assumptions, totally transparent inputs. Or open one of the live deals below to see the full breakdown including the deal score, BRRRR potential, 10-year IRR projection, and rent comps used.
Pulled in real-time from RealixData's deal scanner — these are actual active listings re-priced with our cash-flow + ROI model. Updated every 12 hours.
Deatsville, AL 36022
Why we like it: hits the 1% rule · $1176/mo in positive cash flow after PITI.
See full rankingAlexander City, AL 35010
Why we like it: hits the 1% rule · $784/mo in positive cash flow after PITI.
See full rankingCleveland, OH 44102
Why we like it: hits the 1% rule · 11.5% cap is well above the 7% floor most investors require.
See full rankingWant to dig into the underwriting? Browse the full Top Deals list or run the numbers yourself with our Cash Flow Calculator.
Cash flow is the single most important number for buy-and-hold investors — and the easiest one for blogs to lie about. Here's exactly how we compute it on every property on this page.
These are the inputs RealixData uses unless you override them in the calculator. They're conservative on purpose — a deal that pencils with these numbers has real margin of safety.
Vacancy
5% of gross rent (industry-standard for stabilized SFR / small MF)
Maintenance
8% of gross rent (covers turnover, repairs, periodic capex)
Property management
8% of gross rent (used even for self-managed deals — it's a real opportunity cost)
Property tax
Pulled live from county assessor data via Realie API; falls back to state average if unavailable
Insurance
0.5% of purchase price annually (adjusted up to 1.2% for FL coastal, hail-belt TX/OK, wildfire-zone CA)
Mortgage rate
Live 30-year fixed investor rate, refreshed daily from FRED / Mortgage News Daily
Down payment
20% (changeable on the calculator if you put more or less down)
HOA
Pulled from listing where available; defaults to $0 when not disclosed
Override any of these on a per-deal basis using our Cash Flow Calculator. Curious how the deal score itself works? See the full scoring breakdown.
Cash flow is your monthly profit after every expense: mortgage payment (principal + interest), property taxes, insurance, vacancy reserve, maintenance, property management, and HOA. Gross rent minus all of that = net cash flow. RealixData assumes conservative defaults (5% vacancy, 8% maintenance, 8% property management) so a 'cash flowing' deal here genuinely cash flows in real life.
$300–$500/month per unit is the standard 'good' threshold in 2026. $500–$800 is great. $800+ is exceptional and usually requires a value-add play, a sub-market acquisition, or a true off-market deal. Anything below $200/month per unit gives you almost no margin of safety against vacancy or capex surprises.
Listings are pulled from Zillow every 12 hours. Rent estimates are recomputed against the latest RentCast comps on every refresh. Mortgage rates are updated daily from FRED. So the numbers you see on this page are at most ~12 hours old — and the lastmod stamp on our sitemap reflects exactly when the underlying data was last refreshed.
Trust but verify. Our defaults are conservative on purpose, but every market has quirks — a coastal Florida insurance quote can be 3× the state average, a Texas property in MUD-tax territory pays an extra 1–1.5% annually, an HOA-heavy condo eats hundreds per month. Always pull the actual insurance quote and verify the tax bill before closing. Use our Cash Flow Calculator to override any assumption with a real number.
We do scan some California and New York markets, but the math almost never produces meaningful cash flow at current price-to-rent ratios. A $900k SFR in San Jose renting for $3,200/month has a 0.35% rent-to-price ratio — there's no defensible cash flow possible. We surface what passes our underwriting; we don't fabricate deals to look good geographically.
Austin Reese · Founder, RealixData
Austin Reese is the founder of RealixData, a real estate investment analysis platform that evaluates cash flow, cap rate, and ROI using live market data across 100 US markets. He has spent years analyzing rental properties and investment deals across the Southeast and Midwest, focusing on data-driven underwriting for buy-and-hold, multifamily, and BRRRR investors. RealixData was built to make the same analysis he does on his own deals available to every investor — without the spreadsheet.
Search all markets, run detailed analysis, and get deal alerts with a free account.